Table I Summary of provisional cases of selected notifiable diseases, United States, cumulative, week ending February 1, 2014 (5th Week)
Figure I Selected notifiable disease reports, United States, comparison of provisional 4-week totals ending February 1, 2014, with historical data
Table II Provisional cases of selected notifiable diseases, United States, weeks ending February 1, 2014 and February 2, 2013 (5th Week)
Table III Deaths in 122 U.S. cities, week ending February 1, 2014 (5th Week)
TABLE I. Provisional cases of infrequently reported notifiable diseases (<1,000 cases reported during the preceding year) — United States, week ending February 1, 2014 (5th week)* (Export data)
TABLE I. (Continued) Provisional cases of infrequently reported notifiable diseases (<1,000 cases reported during the preceding year) — United States, week ending February 1, 2014 (5th week)*
—: No reported cases. N: Not reportable. NN: Not Nationally Notifiable. Cum: Cumulative year-to-date counts.
† Calculated by summing the incidence counts for the current week, the 2 weeks preceding the current week, and the 2 weeks following the current week, for a total of 5 preceding years. Additional information is available at http://wwwn.cdc.gov/nndss/document/5yearweeklyaverage.pdf.
§ Not reportable in all states. Data from states where the condition is not reportable are excluded from this table except starting in 2007 for the arboviral diseases, STD data, TB data, and influenza-associated pediatric mortality, and in 2003 for SARS-CoV. Reporting exceptions are available at http://wwwn.cdc.gov/nndss/document/SRCA_FINAL_REPORT_2006-2012_final.xlsx.
¶ Includes both neuroinvasive and nonneuroinvasive. Updated weekly from reports to the Division of Vector-Borne Infectious Diseases, National Center for Zoonotic, Vector-Borne, and Enteric Diseases (ArboNET Surveillance). Data for West Nile virus are available in Table II.
** Data for H. influenzae (all ages, all serotypes) are available in Table II.
†† Updated weekly from reports to the Influenza Division, National Center for Immunization and Respiratory Diseases. Since September 29, 2013, 40 influenza-associated pediatric deaths occurring during the 2013-14 influenza season have been reported.
§§ Of the five measles cases reported for the current week, one was indigenous and four were imported.
¶¶ Data for meningococcal disease (all serogroups) are available in Table II.
*** CDC discontinued reporting of individual confirmed and probable cases of influenza A (H1N1)pdm09 virus infections on July 24, 2009. During 2009, four cases of human infection with novel influenza A viruses, different from the influenza A (H1N1)pdm09 virus, were reported to CDC. The four cases of novel influenza A virus infection reported to CDC during 2010, the fourteen cases reported during 2011, the 313 cases reported in 2012, and the 21 cases reported during 2013 are different from the influenza A (H1N1)pdm09 virus. Total case counts are provided by the Influenza Division, National Center for Immunization and Respiratory Diseases (NCIRD).
††† No rubella cases were reported for the current week.
§§§ Updated weekly from reports to the Division of STD Prevention, National Center for HIV/AIDS, Viral Hepatitis, STD, and TB Prevention.
¶¶¶ There were no cases of viral hemorrhagic fever reported during the current week. See Table II for dengue hemorrhagic fever.
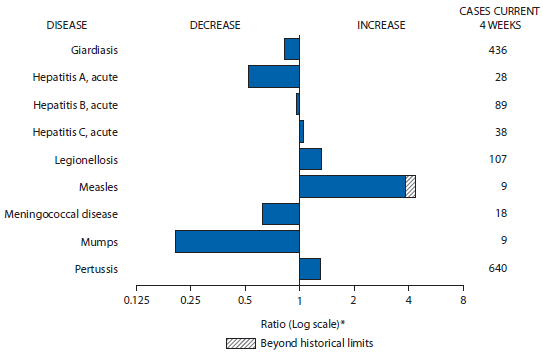
FIGURE I. Selected notifiable disease reports, United States, comparison of provisional 4-week totals February 1, 2014, with historical data
* Ratio of current 4-week total to mean of 15 4-week totals (from previous, comparable, and subsequent 4-week periods for the past 5 years). The point where the hatched area begins is based on the mean and two standard deviations of these 4-week totals.
Alternate Text: The figure above shows selected notifiable disease reports for the United States for the week ending February 1, 2014. Reports of acute hepatitis C, legionellosis, measles, and pertussis increased. Measles increased beyond historical limits. Reports of giardiasis, acute hepatitis A, acute hepatitis B, meningococcal disease, and mumps decreased.
TABLE II. Provisional cases of selected notifiable diseases, United States, weeks ending February 1, 2014, and February 2, 2013 (5th week)* (Export data)
Reporting area
Babesiosis
Chlamydia trachomatis infection
Coccidioidomycosis
Current week
Previous 52 weeks
Cum 2014
Cum 2013
Current week
Previous 52 weeks
Cum 2014
Cum 2013
Current week
Previous 52 weeks
Cum 2014
Cum 2013
Med
Max
Med
Max
Med
Max
United States
1
14
132
5
9
11,731
27,655
30,333
86,996
138,882
44
206
296
684
1,188
New England
1
3
70
5
6
586
900
1,155
2,371
4,839
—
0
0
—
1
Connecticut
—
1
33
1
2
111
235
379
599
1,210
N
0
0
N
N
Maine
—
0
6
1
—
—
62
110
—
339
N
0
0
N
N
Massachusetts
1
1
43
3
3
460
429
680
1,411
2,274
—
0
0
—
—
New Hampshire
—
0
1
—
1
2
58
73
11
344
—
0
0
—
1
Rhode Island
—
0
26
—
—
—
81
160
217
381
—
0
0
—
—
Vermont
—
0
1
—
—
13
33
96
133
291
N
0
0
N
N
Mid. Atlantic
—
7
56
—
2
2,608
3,410
3,737
14,199
15,839
—
0
0
—
—
New Jersey
—
0
24
—
2
218
558
628
2,188
2,787
N
0
0
N
N
New York (Upstate)
—
3
41
—
—
792
745
1,592
2,498
2,443
N
0
0
N
N
New York City
—
0
12
—
—
598
1,084
1,291
4,612
5,695
N
0
0
N
N
Pennsylvania
N
0
0
N
N
1,000
1,009
1,328
4,901
4,914
N
0
0
N
N
E.N. Central
—
0
11
—
—
1,314
4,898
5,703
10,915
26,597
2
0
2
6
3
Illinois
—
0
0
—
—
33
2,039
2,608
1,373
12,313
N
0
0
N
N
Indiana
—
0
1
—
—
216
564
793
1,770
2,558
N
0
0
N
N
Michigan
—
0
0
—
—
453
852
1,091
2,734
4,033
—
0
2
3
1
Ohio
N
0
0
N
N
345
1,028
1,151
3,194
5,359
2
0
2
3
—
Wisconsin
—
0
11
—
—
267
427
517
1,844
2,334
—
0
0
—
2
W.N. Central
—
0
1
—
—
314
1,541
1,753
4,239
7,610
—
1
7
1
—
Iowa
N
0
0
N
N
23
202
243
783
992
N
0
0
N
N
Kansas
N
0
0
N
N
21
210
246
619
1,017
N
0
0
N
N
Minnesota
—
0
0
—
—
—
334
421
—
1,805
—
1
5
—
—
Missouri
N
0
0
N
N
122
527
632
1,869
2,357
—
0
3
1
—
Nebraska
—
0
1
—
—
111
141
227
552
717
—
0
1
—
—
North Dakota
—
0
1
—
—
8
51
78
132
288
—
0
2
—
—
South Dakota
—
0
0
—
—
29
73
95
284
434
N
0
0
N
N
S. Atlantic
—
0
2
—
—
3,474
5,385
6,543
20,476
26,872
1
0
1
1
1
Delaware
—
0
1
—
—
65
89
220
225
745
—
0
1
—
—
District of Columbia
N
0
0
N
N
—
124
284
—
605
—
0
0
—
—
Florida
N
0
0
N
N
994
1,543
1,756
6,672
7,371
N
0
0
N
N
Georgia
N
0
0
N
N
348
972
1,193
3,148
4,668
N
0
0
N
N
Maryland
—
0
2
—
—
319
467
878
1,091
1,710
1
0
1
1
1
North Carolina
N
0
0
N
N
616
947
1,370
4,565
5,805
N
0
0
N
N
South Carolina
—
0
0
—
—
378
508
929
2,698
2,494
N
0
0
N
N
Virginia
N
0
0
N
N
717
623
940
1,784
3,049
N
0
0
N
N
West Virginia
—
0
1
—
—
37
99
129
293
425
N
0
0
N
N
E.S. Central
—
0
0
—
—
908
1,817
2,203
5,360
8,140
—
0
0
—
—
Alabama
—
0
0
—
—
—
557
874
1,065
2,398
N
0
0
N
N
Kentucky
N
0
0
N
N
407
327
570
1,485
1,299
N
0
0
N
N
Mississippi
N
0
0
N
N
294
333
729
1,758
1,768
N
0
0
N
N
Tennessee
—
0
0
—
—
207
573
841
1,052
2,675
N
0
0
N
N
W.S. Central
—
0
1
—
—
68
3,498
4,309
7,338
18,910
—
0
1
—
—
Arkansas
N
0
0
N
N
—
289
372
362
1,536
N
0
0
N
N
Louisiana
—
0
1
—
—
17
449
966
271
963
—
0
1
—
—
Oklahoma
N
0
0
N
N
51
274
599
696
3,754
N
0
0
N
N
Texas
N
0
0
N
N
—
2,507
3,002
6,009
12,657
N
0
0
N
N
Mountain
—
0
0
—
—
947
1,699
2,295
8,345
7,535
5
132
229
550
859
Arizona
N
0
0
N
N
—
522
945
3,243
1,546
5
129
220
545
846
Colorado
N
0
0
N
N
514
386
586
2,122
1,905
N
0
0
N
N
Idaho
N
0
0
N
N
102
103
233
453
395
N
0
0
N
N
Montana
—
0
0
—
—
80
75
104
381
352
—
0
1
1
—
Nevada
N
0
0
N
N
—
216
322
591
971
—
1
6
1
5
New Mexico
N
0
0
N
N
152
216
398
890
1,601
—
0
3
—
4
Utah
—
0
0
—
—
99
147
164
665
629
—
1
4
3
4
Wyoming
—
0
0
—
—
—
26
64
—
136
—
0
1
—
—
Pacific
—
0
2
—
1
1,512
4,191
4,718
13,753
22,540
36
64
90
126
324
Alaska
N
0
0
N
N
49
106
145
366
602
—
0
0
—
—
California
—
0
2
—
1
1,047
3,217
3,682
10,229
17,734
36
64
90
126
323
Hawaii
N
0
0
N
N
3
128
158
365
652
N
0
0
N
N
Oregon
—
0
0
—
—
—
283
475
1,052
1,223
—
0
1
—
1
Washington
—
0
0
—
—
413
459
582
1,741
2,329
N
0
0
N
N
Territories
American Samoa
N
—
—
N
N
—
—
—
—
—
N
—
—
N
N
C.N.M.I.
—
—
—
—
—
—
—
—
—
—
—
—
—
—
—
Guam
—
0
0
—
—
—
0
0
—
—
—
0
0
—
—
Puerto Rico
N
0
0
N
N
—
112
279
229
372
N
0
0
N
N
U.S. Virgin Islands
N
0
0
N
N
—
15
25
—
75
—
0
0
—
—
C.N.M.I.: Commonwealth of Northern Mariana Islands.
U: Unavailable. —: No reported cases. N: Not reportable. NN: Not Nationally Notifiable. Cum: Cumulative year-to-date counts. Med: Median. Max: Maximum.
TABLE II. (Continued) Provisional cases of selected notifiable diseases, United States, weeks ending February 1, 2014, and February 2, 2013 (5th week)* (Export data)
Reporting area
Cryptosporidiosis
Dengue Virus Infection
Dengue Fever†
Dengue Hemorrhagic Fever§
Current week
Previous 52 weeks
Cum 2014
Cum 2013
Current week
Previous 52 weeks
Cum 2014
Cum 2013
Current week
Previous 52 weeks
Cum 2014
Cum 2013
Med
Max
Med
Max
Med
Max
United States
36
102
434
268
460
—
9
43
5
74
—
0
2
—
—
New England
1
4
14
14
11
—
0
3
—
5
—
0
0
—
—
Connecticut
—
0
5
3
3
—
0
2
—
3
—
0
0
—
—
Maine
1
0
4
1
1
—
0
0
—
—
—
0
0
—
—
Massachusetts
—
2
7
8
3
—
0
0
—
—
—
0
0
—
—
New Hampshire
—
0
2
—
2
—
0
0
—
1
—
0
0
—
—
Rhode Island
—
0
2
—
—
—
0
1
—
—
—
0
0
—
—
Vermont
—
0
2
2
2
—
0
1
—
1
—
0
0
—
—
Mid. Atlantic
5
12
42
29
48
—
3
12
—
26
—
0
1
—
—
New Jersey
—
1
5
—
5
—
0
0
—
—
—
0
0
—
—
New York (Upstate)
4
4
16
13
9
—
1
3
—
10
—
0
1
—
—
New York City
—
1
6
3
5
—
2
9
—
10
—
0
1
—
—
Pennsylvania
1
6
30
13
29
—
0
3
—
6
—
0
0
—
—
E.N. Central
4
24
63
44
112
—
1
5
2
6
—
0
0
—
—
Illinois
—
4
16
—
18
—
0
3
—
1
—
0
0
—
—
Indiana
—
2
7
3
12
—
0
1
—
1
—
0
0
—
—
Michigan
—
4
15
5
23
—
0
3
—
2
—
0
0
—
—
Ohio
3
6
17
20
31
—
0
2
2
1
—
0
0
—
—
Wisconsin
1
7
24
16
28
—
0
1
—
1
—
0
0
—
—
W.N. Central
3
16
171
29
52
—
1
3
2
3
—
0
1
—
—
Iowa
—
5
155
5
15
—
0
0
—
—
—
0
1
—
—
Kansas
—
2
6
1
2
—
0
1
—
1
—
0
0
—
—
Minnesota
—
0
0
—
—
—
0
2
—
2
—
0
0
—
—
Missouri
2
3
11
12
19
—
0
2
2
—
—
0
0
—
—
Nebraska
—
2
11
6
8
—
0
0
—
—
—
0
0
—
—
North Dakota
—
1
7
2
2
—
0
1
—
—
—
0
0
—
—
South Dakota
1
3
17
3
6
—
0
1
—
—
—
0
0
—
—
S. Atlantic
18
18
53
90
109
—
1
9
1
23
—
0
1
—
—
Delaware
—
0
2
1
—
—
0
1
—
—
—
0
0
—
—
District of Columbia
N
0
0
N
N
—
0
0
—
—
—
0
0
—
—
Florida
14
8
23
42
29
—
0
6
—
16
—
0
0
—
—
Georgia
2
5
16
28
23
—
0
2
—
—
—
0
0
—
—
Maryland
1
1
4
4
5
—
0
1
1
1
—
0
0
—
—
North Carolina
—
0
25
3
38
—
0
2
—
1
—
0
0
—
—
South Carolina
—
1
7
4
10
—
0
4
—
1
—
0
0
—
—
Virginia
1
0
7
8
1
—
0
3
—
4
—
0
1
—
—
West Virginia
—
0
2
—
3
—
0
1
—
—
—
0
0
—
—
E.S. Central
1
6
18
18
18
—
0
2
—
3
—
0
0
—
—
Alabama
—
2
8
11
11
—
0
2
—
1
—
0
0
—
—
Kentucky
—
1
5
3
2
—
0
0
—
—
—
0
0
—
—
Mississippi
—
0
5
—
2
—
0
1
—
1
—
0
0
—
—
Tennessee
1
1
6
4
3
—
0
2
—
1
—
0
0
—
—
W.S. Central
1
11
39
13
46
—
0
11
—
1
—
0
0
—
—
Arkansas
—
1
12
1
3
—
0
1
—
—
—
0
0
—
—
Louisiana
—
3
31
5
25
—
0
1
—
—
—
0
0
—
—
Oklahoma
—
1
4
1
3
—
0
2
—
—
—
0
0
—
—
Texas
1
5
21
6
15
—
0
11
—
1
—
0
0
—
—
Mountain
—
8
51
12
27
—
0
1
—
—
—
0
0
—
—
Arizona
—
1
6
2
3
—
0
0
—
—
—
0
0
—
—
Colorado
—
0
4
1
4
—
0
0
—
—
—
0
0
—
—
Idaho
—
2
16
5
3
—
0
1
—
—
—
0
0
—
—
Montana
—
1
19
2
2
—
0
1
—
—
—
0
0
—
—
Nevada
—
0
2
—
1
—
0
1
—
—
—
0
0
—
—
New Mexico
—
1
3
1
3
—
0
0
—
—
—
0
0
—
—
Utah
—
1
7
1
11
—
0
0
—
—
—
0
0
—
—
Wyoming
—
0
25
—
—
—
0
1
—
—
—
0
0
—
—
Pacific
3
10
75
19
37
—
2
8
—
7
—
0
0
—
—
Alaska
—
0
1
—
—
—
0
1
—
—
—
0
0
—
—
California
3
5
15
15
24
—
1
8
—
4
—
0
0
—
—
Hawaii
—
0
1
—
—
—
0
2
—
1
—
0
0
—
—
Oregon
—
3
58
3
12
—
0
0
—
—
—
0
0
—
—
Washington
—
1
12
1
1
—
0
2
—
2
—
0
0
—
—
Territories
American Samoa
N
—
—
N
N
—
—
—
—
—
—
—
—
—
—
C.N.M.I.
—
—
—
—
—
—
—
—
—
—
—
—
—
—
—
Guam
—
0
0
—
—
—
0
0
—
—
—
0
0
—
—
Puerto Rico
N
0
0
N
N
—
105
424
—
1,258
—
0
5
—
2
U.S. Virgin Islands
—
0
0
—
—
—
0
0
—
—
—
0
0
—
—
C.N.M.I.: Commonwealth of Northern Mariana Islands.
U: Unavailable. —: No reported cases. N: Not reportable. NN: Not Nationally Notifiable. Cum: Cumulative year-to-date counts. Med: Median. Max: Maximum.
† Dengue Fever includes cases that meet criteria for Dengue Fever with hemorrhage, other clinical and unknown case classifications.
§ DHF includes cases that meet criteria for dengue shock syndrome (DSS), a more severe form of DHF.
TABLE II. (Continued) Provisional cases of selected notifiable diseases, United States, weeks ending February 1, 2014, and February 2, 2013 (5th week)* (Export data)
Reporting area
Ehrlichiosis/Anaplasmosis†
Ehrlichia chaffeensis
Anaplasma phagocytophilum
Undetermined
Current week
Previous 52 weeks
Cum 2014
Cum 2013
Current week
Previous 52 weeks
Cum 2014
Cum 2013
Current week
Previous 52 weeks
Cum 2014
Cum 2013
Med
Max
Med
Max
Med
Max
United States
—
14
92
3
9
—
25
94
6
13
—
2
22
—
1
New England
—
0
8
—
1
—
4
23
1
2
—
0
1
—
—
Connecticut
—
0
0
—
—
—
0
10
—
1
—
0
0
—
—
Maine
—
0
1
—
—
—
1
8
1
—
—
0
1
—
—
Massachusetts
—
0
0
—
—
—
0
0
—
—
—
0
0
—
—
New Hampshire
—
0
1
—
1
—
1
7
—
1
—
0
0
—
—
Rhode Island
—
0
8
—
—
—
0
14
—
—
—
0
0
—
—
Vermont
—
0
1
—
—
—
0
3
—
—
—
0
0
—
—
Mid. Atlantic
—
2
10
1
—
—
7
31
3
2
—
0
3
—
—
New Jersey
—
0
1
—
—
—
0
4
—
—
—
0
1
—
—
New York (Upstate)
—
1
9
1
—
—
7
28
3
1
—
0
3
—
—
New York City
—
0
5
—
—
—
0
4
—
1
—
0
1
—
—
Pennsylvania
—
0
1
—
—
—
0
0
—
—
—
0
0
—
—
E.N. Central
—
1
8
—
1
—
10
45
1
7
—
1
17
—
1
Illinois
—
0
7
—
—
—
0
2
—
1
—
0
0
—
—
Indiana
—
0
0
—
—
—
0
0
—
—
—
1
12
—
1
Michigan
—
0
0
—
—
—
0
0
—
—
—
0
3
—
—
Ohio
—
0
1
—
1
—
0
1
—
—
—
0
1
—
—
Wisconsin
—
0
6
—
—
—
10
43
1
6
—
0
5
—
—
W.N. Central
—
2
45
—
1
—
0
4
—
—
—
0
2
—
—
Iowa
N
0
0
N
N
N
0
0
N
N
N
0
0
N
N
Kansas
—
1
8
—
1
—
0
1
—
—
—
0
0
—
—
Minnesota
—
0
0
—
—
—
0
0
—
—
—
0
0
—
—
Missouri
—
1
39
—
—
—
0
2
—
—
—
0
2
—
—
Nebraska
—
0
1
—
—
—
0
1
—
—
—
0
0
—
—
North Dakota
—
0
0
—
—
—
0
2
—
—
—
0
1
—
—
South Dakota
—
0
1
—
—
—
0
0
—
—
—
0
0
—
—
S. Atlantic
—
1
22
1
4
—
0
3
1
1
—
0
2
—
—
Delaware
—
0
2
—
—
—
0
1
1
—
—
0
1
—
—
District of Columbia
N
0
0
N
N
N
0
0
N
N
N
0
0
N
N
Florida
—
0
3
—
—
—
0
1
—
—
—
0
0
—
—
Georgia
—
0
2
—
4
—
0
1
—
—
—
0
0
—
—
Maryland
—
0
5
1
—
—
0
1
—
1
—
0
1
—
—
North Carolina
—
0
12
—
—
—
0
3
—
—
—
0
0
—
—
South Carolina
—
0
1
—
—
—
0
0
—
—
—
0
0
—
—
Virginia
—
0
3
—
—
—
0
2
—
—
—
0
1
—
—
West Virginia
—
0
1
—
—
—
0
1
—
—
—
0
1
—
—
E.S. Central
—
1
14
1
2
—
0
1
—
1
—
0
3
—
—
Alabama
—
0
2
1
—
—
0
1
—
—
—
0
1
—
—
Kentucky
—
0
7
—
1
—
0
0
—
—
—
0
0
—
—
Mississippi
—
0
1
—
—
—
0
0
—
—
—
0
1
—
—
Tennessee
—
0
9
—
1
—
0
1
—
1
—
0
3
—
—
W.S. Central
—
2
37
—
—
—
0
1
—
—
—
0
0
—
—
Arkansas
—
2
17
—
—
—
0
1
—
—
—
0
0
—
—
Louisiana
—
0
1
—
—
—
0
1
—
—
—
0
0
—
—
Oklahoma
—
0
34
—
—
—
0
1
—
—
—
0
0
—
—
Texas
—
0
1
—
—
—
0
0
—
—
—
0
0
—
—
Mountain
—
0
1
—
—
—
0
1
—
—
—
0
1
—
—
Arizona
—
0
0
—
—
—
0
0
—
—
—
0
1
—
—
Colorado
N
0
0
N
N
N
0
0
N
N
N
0
0
N
N
Idaho
N
0
0
N
N
N
0
0
N
N
N
0
0
N
N
Montana
—
0
0
—
—
—
0
0
—
—
—
0
0
—
—
Nevada
—
0
0
—
—
—
0
1
—
—
—
0
0
—
—
New Mexico
N
0
0
N
N
N
0
0
N
N
N
0
0
N
N
Utah
—
0
1
—
—
—
0
0
—
—
—
0
0
—
—
Wyoming
—
0
0
—
—
—
0
0
—
—
—
0
0
—
—
Pacific
—
0
0
—
—
—
0
0
—
—
—
0
1
—
—
Alaska
N
0
0
N
N
N
0
0
N
N
N
0
0
N
N
California
—
0
0
—
—
—
0
0
—
—
—
0
1
—
—
Hawaii
N
0
0
N
N
N
0
0
N
N
N
0
0
N
N
Oregon
—
0
0
—
—
—
0
0
—
—
—
0
0
—
—
Washington
—
0
0
—
—
—
0
0
—
—
—
0
0
—
—
Territories
American Samoa
N
—
—
N
N
N
—
—
N
N
N
—
—
N
N
C.N.M.I.
—
—
—
—
—
—
—
—
—
—
—
—
—
—
—
Guam
N
0
0
N
N
N
0
0
N
N
N
0
0
N
N
Puerto Rico
N
0
0
N
N
N
0
0
N
N
N
0
0
N
N
U.S. Virgin Islands
—
0
0
—
—
—
0
0
—
—
—
0
0
—
—
C.N.M.I.: Commonwealth of Northern Mariana Islands.
U: Unavailable. —: No reported cases. N: Not reportable. NN: Not Nationally Notifiable. Cum: Cumulative year-to-date counts. Med: Median. Max: Maximum.
† Cumulative total E. ewingii cases reported for year 2013 = 22, and 0 cases reported for 2014.
TABLE II. (Continued) Provisional cases of selected notifiable diseases, United States, weeks ending February 1, 2014, and February 2, 2013 (5th week)* (Export data)
Reporting area
Giardiasis
Gonorrhea
Haemophilus influenzae, invasive† All ages, all serotypes
Current week
Previous 52 weeks
Cum 2014
Cum 2013
Current week
Previous 52 weeks
Cum 2014
Cum 2013
Current week
Previous 52 weeks
Cum 2014
Cum 2013
Med
Max
Med
Max
Med
Max
United States
129
241
409
752
1,109
2,738
6,508
7,253
21,476
33,471
29
63
99
268
466
New England
5
23
58
67
93
73
129
192
423
583
1
4
9
20
31
Connecticut
—
5
11
9
13
1
54
112
117
216
—
1
4
—
7
Maine
2
4
12
11
11
—
4
10
—
33
1
0
2
1
5
Massachusetts
3
11
26
41
62
71
60
100
279
281
—
2
6
14
16
New Hampshire
—
1
7
1
2
1
2
8
15
17
—
0
3
3
2
Rhode Island
—
0
7
—
1
—
6
40
9
29
—
0
8
—
—
Vermont
—
2
14
5
4
—
1
8
3
7
—
0
2
2
1
Mid. Atlantic
42
48
89
175
192
528
771
914
3,183
3,727
6
11
22
42
84
New Jersey
—
5
12
4
26
54
133
167
509
699
—
1
6
8
20
New York (Upstate)
25
18
51
57
44
111
122
290
364
447
4
3
15
12
12
New York City
9
14
24
58
63
111
253
308
1,009
1,380
—
2
7
1
17
Pennsylvania
8
13
27
56
59
252
273
326
1,301
1,201
2
4
11
21
35
E.N. Central
12
36
63
72
174
323
1,221
1,506
2,877
7,213
3
11
17
34
75
Illinois
—
6
23
1
27
12
504
663
311
3,205
—
3
6
4
22
Indiana
—
3
11
3
19
43
145
209
457
637
—
3
6
5
14
Michigan
—
10
27
11
35
109
191
276
677
1,165
—
2
5
5
12
Ohio
9
9
25
36
50
108
315
384
1,062
1,739
3
3
8
20
16
Wisconsin
3
7
15
21
43
51
82
122
370
467
—
0
4
—
11
W.N. Central
4
16
41
40
84
68
331
417
902
1,639
2
5
9
18
30
Iowa
—
4
15
11
12
1
28
41
86
165
—
0
0
—
—
Kansas
—
2
6
2
8
8
39
66
148
155
—
0
3
—
4
Minnesota
—
0
0
—
—
—
69
87
—
375
—
1
5
—
9
Missouri
3
5
15
17
33
45
152
184
549
695
2
2
6
17
12
Nebraska
1
3
9
9
18
14
25
48
84
146
—
0
3
1
3
North Dakota
—
0
3
—
3
—
8
15
15
42
—
0
2
—
2
South Dakota
—
2
9
1
10
—
14
27
20
61
—
0
1
—
—
S. Atlantic
38
44
91
197
173
913
1,382
1,754
5,717
7,228
10
16
33
77
124
Delaware
—
0
2
—
1
19
25
65
94
140
—
0
1
1
3
District of Columbia
—
0
3
—
11
—
48
85
—
164
1
0
2
1
3
Florida
15
20
56
93
104
237
395
493
1,815
2,036
9
5
13
38
28
Georgia
15
11
45
61
22
111
267
434
870
1,432
—
2
8
12
29
Maryland
6
4
9
28
22
69
111
174
294
389
—
2
5
10
14
North Carolina
N
0
0
N
N
197
266
412
1,343
1,617
—
3
12
13
21
South Carolina
2
2
7
7
10
114
144
280
852
720
—
2
7
—
23
Virginia
—
1
10
8
—
153
122
237
371
645
—
0
4
1
—
West Virginia
—
1
4
—
3
13
20
34
78
85
—
0
3
1
3
E.S. Central
—
3
8
14
13
245
470
600
1,392
2,486
1
4
12
19
42
Alabama
—
3
8
14
13
—
152
257
285
760
—
1
4
10
18
Kentucky
N
0
0
N
N
111
85
143
392
372
—
0
4
—
6
Mississippi
N
0
0
N
N
74
98
185
469
555
—
0
2
3
3
Tennessee
N
0
0
N
N
60
141
210
246
799
1
2
6
6
15
W.S. Central
1
6
15
18
21
14
950
1,170
2,143
5,058
—
3
11
17
10
Arkansas
1
2
7
5
4
—
72
108
142
438
—
0
3
5
—
Louisiana
—
5
11
13
17
3
135
326
79
261
—
1
6
4
6
Oklahoma
—
0
0
—
—
11
82
177
227
968
—
2
9
8
4
Texas
N
0
0
N
N
—
655
823
1,695
3,391
—
0
1
—
—
Mountain
3
17
37
50
89
104
272
396
1,263
1,143
4
5
14
28
47
Arizona
—
2
7
1
5
—
107
187
571
358
2
2
7
12
18
Colorado
—
3
18
25
31
66
54
90
298
284
—
1
4
6
13
Idaho
1
2
9
4
9
2
3
14
7
11
2
0
2
3
2
Montana
1
2
6
4
2
5
4
10
23
15
—
0
1
1
1
Nevada
—
1
6
4
6
—
51
85
152
223
—
0
1
1
3
New Mexico
—
1
6
—
9
10
36
78
96
181
—
1
3
1
8
Utah
1
4
9
12
17
21
20
31
116
69
—
1
2
4
2
Wyoming
—
0
6
—
10
—
1
3
—
2
—
0
1
—
—
Pacific
24
53
125
119
270
470
891
1,105
3,576
4,394
2
3
9
13
23
Alaska
1
1
7
4
3
13
21
39
105
89
—
0
3
—
1
California
19
32
102
86
223
381
745
951
2,962
3,591
—
1
5
2
7
Hawaii
—
1
3
2
1
1
13
26
40
91
1
0
2
1
1
Oregon
2
6
17
21
36
—
33
57
152
194
1
1
5
10
14
Washington
2
10
45
6
7
75
79
113
317
429
—
0
2
—
—
Territories
American Samoa
—
—
—
—
—
—
—
—
—
—
—
—
—
—
—
C.N.M.I.
—
—
—
—
—
—
—
—
—
—
—
—
—
—
—
Guam
—
0
0
—
—
—
0
0
—
—
—
0
0
—
—
Puerto Rico
—
0
4
—
2
—
6
21
24
21
—
0
0
—
—
U.S. Virgin Islands
—
0
0
—
—
—
1
5
—
7
—
0
0
—
—
C.N.M.I.: Commonwealth of Northern Mariana Islands.
U: Unavailable. —: No reported cases. N: Not reportable. NN: Not Nationally Notifiable. Cum: Cumulative year-to-date counts. Med: Median. Max: Maximum.
† Data for H. influenzae (age <5 yrs for serotype b, nonserotype b, and unknown serotype) are available in Table I.
TABLE II. (Continued) Provisional cases of selected notifiable diseases, United States, weeks ending February 1, 2014, and February 2, 2013 (5th week)* (Export data)
Reporting area
Hepatitis (viral, acute), by type
A
B
C
Current week
Previous 52 weeks
Cum 2014
Cum 2013
Current week
Previous 52 weeks
Cum 2014
Cum 2013
Current week
Previous 52 weeks
Cum 2014
Cum 2013
Med
Max
Med
Max
Med
Max
United States
7
30
56
53
108
24
54
73
147
233
16
34
53
57
132
New England
—
1
5
3
5
—
1
4
—
5
—
3
7
—
16
Connecticut
—
0
2
1
1
—
0
1
—
—
—
0
0
—
—
Maine
—
0
2
—
—
—
0
1
—
3
—
0
1
—
1
Massachusetts
—
0
3
—
3
—
0
3
—
2
—
2
7
—
14
New Hampshire
—
0
1
—
—
—
0
2
—
—
N
0
0
N
N
Rhode Island
—
0
1
1
—
U
0
0
U
U
U
0
0
U
U
Vermont
—
0
2
1
1
—
0
1
—
—
—
0
1
—
1
Mid. Atlantic
1
4
12
6
11
2
3
10
15
22
4
4
11
7
20
New Jersey
—
0
2
—
2
—
0
3
—
6
—
0
3
—
7
New York (Upstate)
1
1
5
2
2
2
1
3
3
2
2
2
9
2
4
New York City
—
1
7
3
6
—
1
4
3
8
—
0
1
—
1
Pennsylvania
—
1
4
1
1
—
1
4
9
6
2
1
6
5
8
E.N. Central
—
5
12
7
32
5
9
15
29
38
3
7
24
15
17
Illinois
—
1
5
—
7
—
1
4
—
10
—
0
4
—
3
Indiana
—
0
2
—
2
—
2
6
4
4
—
3
8
1
6
Michigan
—
1
7
1
10
—
1
5
—
6
—
1
11
2
7
Ohio
—
1
4
6
11
5
4
11
25
18
3
0
18
12
—
Wisconsin
—
1
3
—
2
—
0
2
—
—
—
1
3
—
1
W.N. Central
—
1
6
5
4
1
2
5
6
6
—
0
5
1
3
Iowa
—
0
3
1
1
—
0
2
—
1
—
0
0
—
—
Kansas
—
0
3
1
1
—
0
3
—
—
—
0
3
—
—
Minnesota
—
0
0
—
—
—
0
0
—
—
—
0
0
—
—
Missouri
—
0
2
1
—
—
1
4
5
5
—
0
4
1
3
Nebraska
—
0
2
1
1
1
0
2
1
—
—
0
1
—
—
North Dakota
—
0
2
1
1
—
0
0
—
—
—
0
1
—
—
South Dakota
—
0
1
—
—
—
0
1
—
—
—
0
1
—
—
S. Atlantic
3
5
15
12
16
5
16
26
51
71
5
6
21
16
27
Delaware
—
0
1
—
—
—
0
1
—
2
U
0
0
U
U
District of Columbia
—
0
0
—
—
—
0
0
—
—
—
0
0
—
—
Florida
3
2
7
6
2
2
6
13
26
28
—
2
7
4
10
Georgia
—
1
4
2
7
—
2
6
2
11
—
0
3
—
2
Maryland
—
0
4
1
1
—
1
4
4
4
—
1
3
1
8
North Carolina
—
1
4
—
5
—
1
16
5
5
5
1
15
8
2
South Carolina
—
0
1
—
1
—
1
5
1
3
—
0
0
—
—
Virginia
—
0
2
2
—
—
0
4
2
—
—
0
3
2
1
West Virginia
—
0
1
1
—
3
3
8
11
18
—
0
5
1
4
E.S. Central
2
1
4
5
7
9
12
17
35
54
3
6
14
10
33
Alabama
—
0
2
1
—
—
1
5
9
7
—
0
5
3
—
Kentucky
2
0
2
2
4
1
4
8
3
16
1
3
10
1
24
Mississippi
—
0
1
—
1
1
1
4
2
6
U
0
0
U
U
Tennessee
—
0
2
2
2
7
5
11
21
25
2
2
7
6
9
W.S. Central
1
2
6
3
5
2
5
10
7
13
1
2
7
1
4
Arkansas
—
0
2
—
—
—
1
3
1
4
—
0
3
—
—
Louisiana
—
0
2
—
3
—
1
8
2
3
—
0
2
—
3
Oklahoma
—
0
4
—
—
—
0
4
—
1
1
0
5
1
—
Texas
1
2
5
3
2
2
3
6
4
5
—
0
3
—
1
Mountain
—
2
16
4
8
—
1
4
1
10
—
1
5
2
4
Arizona
—
1
6
1
4
—
0
3
—
4
U
0
0
U
U
Colorado
—
0
8
1
3
—
0
1
—
2
—
0
1
2
—
Idaho
—
0
2
—
—
—
0
2
—
1
—
0
2
—
1
Montana
—
0
1
—
—
—
0
1
—
—
—
0
2
—
1
Nevada
—
0
3
1
—
—
0
3
1
2
—
0
2
—
1
New Mexico
—
0
2
—
1
—
0
0
—
1
—
0
1
—
—
Utah
—
0
2
1
—
—
0
1
—
—
—
0
1
—
1
Wyoming
—
0
0
—
—
—
0
0
—
—
—
0
0
—
—
Pacific
—
6
18
8
20
—
3
11
3
14
—
3
7
5
8
Alaska
—
0
1
—
—
—
0
1
—
—
—
0
0
—
—
California
—
4
17
7
14
—
2
5
1
12
—
1
5
3
7
Hawaii
—
0
4
—
1
—
0
1
—
—
—
0
0
—
—
Oregon
—
0
3
1
3
—
0
4
1
2
—
0
1
—
—
Washington
—
0
4
—
2
—
0
9
1
—
—
1
6
2
1
Territories
American Samoa
—
—
—
—
—
—
—
—
—
—
—
—
—
—
—
C.N.M.I.
—
—
—
—
—
—
—
—
—
—
—
—
—
—
—
Guam
—
0
0
—
—
—
0
0
—
—
—
0
0
—
—
Puerto Rico
—
0
1
—
—
—
0
6
—
4
N
0
0
N
N
U.S. Virgin Islands
—
0
0
—
—
—
0
0
—
—
—
0
0
—
—
C.N.M.I.: Commonwealth of Northern Mariana Islands.
U: Unavailable. —: No reported cases. N: Not reportable. NN: Not Nationally Notifiable. Cum: Cumulative year-to-date counts. Med: Median. Max: Maximum.
TABLE II. (Continued) Provisional cases of selected notifiable diseases, United States, weeks ending February 1, 2014, and February 2, 2013 (5th week)* (Export data)
Reporting area
Invasive Pneumococcal disease†
Legionellosis
All ages
Age <5
Current week
Previous 52 weeks
Cum 2014
Cum 2013
Current week
Previous 52 weeks
Cum 2014
Cum 2013
Current week
Previous 52 weeks
Cum 2014
Cum 2013
Med
Max
Med
Max
Med
Max
United States
186
279
498
1,479
2,553
6
20
36
58
112
38
62
259
182
255
New England
5
10
33
26
104
—
0
3
—
3
2
5
25
18
15
Connecticut
—
4
14
2
66
—
0
2
—
—
—
1
10
3
2
Maine
2
2
6
16
16
—
0
1
—
—
—
0
3
1
1
Massachusetts
—
0
2
1
3
—
0
2
—
3
1
2
20
11
7
New Hampshire
1
1
5
1
8
—
0
1
—
—
—
0
3
1
—
Rhode Island
—
0
18
1
—
—
0
0
—
—
—
0
9
1
3
Vermont
2
1
4
5
11
—
0
0
—
—
1
0
2
1
2
Mid. Atlantic
16
35
74
147
378
—
2
6
3
18
8
16
122
40
45
New Jersey
—
7
21
—
111
—
0
2
—
6
—
2
20
—
13
New York (Upstate)
13
18
37
75
135
—
1
4
1
5
2
6
40
12
9
New York City
3
12
24
72
132
—
0
2
2
7
—
3
47
9
9
Pennsylvania
N
—
—
N
N
N
0
0
N
N
6
6
26
19
14
E.N. Central
22
53
107
242
518
—
3
8
9
10
8
16
103
43
51
Illinois
N
0
0
N
N
—
1
3
2
1
—
4
31
2
7
Indiana
—
12
28
13
97
—
0
3
—
—
2
3
11
3
17
Michigan
2
11
28
52
121
—
1
3
4
3
—
3
21
3
2
Ohio
14
21
47
128
212
—
1
4
3
4
6
6
66
32
22
Wisconsin
6
8
15
49
88
—
0
3
—
2
—
2
11
3
3
W.N. Central
4
14
29
53
186
—
1
4
3
16
—
2
13
6
13
Iowa
N
0
0
N
N
N
0
0
N
N
—
0
2
—
—
Kansas
—
2
6
14
36
N
0
0
N
N
—
0
3
—
1
Minnesota
—
5
16
—
94
—
0
2
—
7
—
0
2
—
3
Missouri
N
0
0
N
N
—
0
3
1
5
—
1
11
4
5
Nebraska
3
2
7
21
21
—
0
1
1
3
—
0
3
—
3
North Dakota
—
1
5
7
16
—
0
1
1
1
—
0
1
1
—
South Dakota
1
2
5
11
19
N
0
0
N
N
—
0
1
1
1
S. Atlantic
67
59
125
408
543
3
5
13
17
24
12
11
36
46
39
Delaware
1
0
3
2
2
—
0
1
—
—
—
0
4
—
—
District of Columbia
6
1
7
9
6
—
0
1
—
—
N
0
0
N
N
Florida
22
18
42
133
188
1
1
5
5
10
6
4
16
23
20
Georgia
7
16
44
107
154
—
1
5
6
7
—
1
5
1
6
Maryland
12
8
26
61
68
1
0
4
4
2
1
2
14
8
8
North Carolina
—
0
0
—
—
N
0
0
N
N
2
1
9
4
3
South Carolina
17
7
27
80
68
1
0
2
2
2
1
0
3
3
1
Virginia
—
0
2
—
—
—
0
2
—
—
2
0
8
7
—
West Virginia
2
4
16
16
57
—
0
2
—
3
—
0
4
—
1
E.S. Central
15
28
59
174
222
1
1
5
7
10
1
3
13
4
10
Alabama
1
3
9
24
33
1
0
2
1
3
—
0
10
—
1
Kentucky
5
4
11
34
39
—
0
1
1
—
—
1
4
1
—
Mississippi
—
4
13
26
33
—
0
2
3
3
—
0
2
—
2
Tennessee
9
14
37
90
117
—
1
5
2
4
1
1
7
3
7
W.S. Central
42
34
236
180
235
2
3
16
14
11
3
3
12
5
10
Arkansas
2
2
19
8
33
—
0
2
—
—
1
0
3
1
1
Louisiana
4
5
16
52
41
—
0
2
3
2
—
0
3
1
3
Oklahoma
1
0
1
2
2
1
0
1
2
2
—
0
3
—
—
Texas
35
23
215
118
159
1
2
16
9
7
2
2
12
3
6
Mountain
14
32
79
233
349
—
2
7
4
17
1
3
9
6
17
Arizona
12
14
42
119
151
—
0
4
3
8
—
1
4
—
5
Colorado
—
7
22
64
87
—
0
2
1
4
—
0
3
—
2
Idaho
N
0
0
N
N
—
0
1
—
1
1
0
2
1
1
Montana
1
0
3
5
2
—
0
1
—
—
—
0
2
2
1
Nevada
1
2
7
16
19
—
0
1
—
—
—
0
3
—
1
New Mexico
—
5
13
26
58
—
0
1
—
2
—
0
2
—
3
Utah
—
2
8
—
29
—
0
2
—
2
—
0
3
3
4
Wyoming
—
0
3
3
3
—
0
1
—
—
—
0
0
—
—
Pacific
1
4
7
16
18
—
0
2
1
3
3
5
13
14
55
Alaska
—
2
6
6
12
—
0
2
—
2
—
0
1
—
—
California
N
0
0
N
N
N
0
0
N
N
3
4
12
12
52
Hawaii
1
1
4
10
6
—
0
1
1
1
—
0
1
—
1
Oregon
N
0
0
N
N
N
0
0
N
N
—
0
3
2
2
Washington
N
0
0
N
N
N
0
0
N
N
—
0
6
—
—
Territories
American Samoa
N
—
—
N
N
—
—
—
—
—
N
—
—
N
N
C.N.M.I.
—
—
—
—
—
—
—
—
—
—
—
—
—
—
—
Guam
—
0
0
—
—
—
0
0
—
—
—
0
0
—
—
Puerto Rico
—
0
0
—
—
—
0
0
—
—
—
0
2
—
2
U.S. Virgin Islands
—
0
0
—
—
—
0
0
—
—
—
0
0
—
—
C.N.M.I.: Commonwealth of Northern Mariana Islands.
U: Unavailable. —: No reported cases. N: Not reportable. NN: Not Nationally Notifiable. Cum: Cumulative year-to-date counts. Med: Median. Max: Maximum.
† Includes drug resistant and susceptible cases of Invasive Pneumococcal Disease. This condition was previously named Streptococcus pneumoniae invasive disease and cases were reported to CDC using different event codes to specify whether the cases were drug resistant or in a defined age group, such as <5 years. Since 2010, case notifications for this condition were consolidated under one event code for Invasive pneumococcal disease
TABLE II. (Continued) Provisional cases of selected notifiable diseases, United States, weeks ending February 1, 2014, and February 2, 2013 (5th week)* (Export data)
Reporting area
Lyme disease
Malaria
Meningococcal disease, invasive† All serogroups
Current week
Previous 52 weeks
Cum 2014
Cum 2013
Current week
Previous 52 weeks
Cum 2014
Cum 2013
Current week
Previous 52 weeks
Cum 2014
Cum 2013
Med
Max
Med
Max
Med
Max
United States
31
372
2,174
254
1,059
13
25
50
74
101
6
9
21
38
79
New England
—
119
878
17
330
—
2
8
4
7
1
0
3
1
5
Connecticut
—
30
251
7
127
—
0
0
—
—
—
0
1
—
1
Maine
—
15
99
6
22
—
0
2
2
—
—
0
1
—
1
Massachusetts
—
36
437
4
136
—
1
4
2
5
1
0
3
1
2
New Hampshire
—
6
91
—
32
—
0
2
—
2
—
0
1
—
—
Rhode Island
—
9
54
—
1
—
0
8
—
—
—
0
0
—
1
Vermont
—
8
92
—
12
—
0
3
—
—
—
0
1
—
—
Mid. Atlantic
22
186
1,004
179
506
4
8
21
25
20
—
1
7
1
8
New Jersey
—
46
224
15
216
—
1
5
—
7
—
0
2
—
3
New York (Upstate)
10
46
258
32
21
3
1
5
5
3
—
0
3
1
2
New York City
—
2
40
—
3
1
4
13
15
10
—
0
2
—
2
Pennsylvania
12
78
539
132
266
—
1
5
5
—
—
0
3
—
1
E.N. Central
—
17
222
10
36
—
2
8
7
13
—
0
4
—
6
Illinois
—
2
30
—
2
—
1
5
1
5
—
0
2
—
2
Indiana
—
1
13
—
—
—
0
2
—
3
—
0
1
—
3
Michigan
—
2
15
2
2
—
0
2
2
3
—
0
1
—
1
Ohio
—
1
7
—
3
—
1
3
4
1
—
0
2
—
—
Wisconsin
—
13
182
8
29
—
0
3
—
1
—
0
1
—
—
W.N. Central
—
3
31
1
2
—
0
3
5
5
—
0
3
1
7
Iowa
—
2
27
—
—
—
0
2
2
—
—
0
1
—
—
Kansas
—
0
4
—
1
—
0
1
—
1
—
0
1
—
—
Minnesota
—
0
0
—
—
—
0
0
—
—
—
0
2
—
3
Missouri
—
0
3
—
1
—
0
1
1
1
—
0
2
1
3
Nebraska
—
0
3
1
—
—
0
2
1
1
—
0
1
—
—
North Dakota
—
0
5
—
—
—
0
1
1
1
—
0
1
—
—
South Dakota
—
0
1
—
—
—
0
3
—
1
—
0
1
—
1
S. Atlantic
8
37
176
43
171
6
5
16
17
36
3
1
6
12
20
Delaware
3
7
23
15
29
—
0
2
1
—
—
0
1
—
—
District of Columbia
N
0
0
N
N
—
0
2
—
1
—
0
1
—
1
Florida
1
2
14
5
6
1
1
3
3
8
3
1
3
7
10
Georgia
—
0
4
—
4
—
1
5
—
7
—
0
2
—
2
Maryland
—
19
76
14
127
4
2
10
9
20
—
0
1
1
1
North Carolina
3
0
32
3
—
1
0
6
1
—
—
0
2
3
4
South Carolina
—
0
2
—
—
—
0
2
—
—
—
0
1
—
—
Virginia
1
4
140
4
3
—
0
4
3
—
—
0
1
1
—
West Virginia
—
1
19
2
2
—
0
1
—
—
—
0
0
—
2
E.S. Central
—
1
9
2
3
—
1
4
4
5
1
0
2
2
3
Alabama
—
0
3
—
1
—
0
1
—
1
—
0
1
—
—
Kentucky
—
0
9
1
1
—
0
1
1
2
1
0
0
1
1
Mississippi
—
0
0
—
—
—
0
1
—
—
—
0
1
—
2
Tennessee
—
0
3
1
1
—
0
3
3
2
—
0
1
1
—
W.S. Central
—
1
7
—
—
—
1
7
—
3
—
1
3
4
2
Arkansas
—
0
0
—
—
—
0
1
—
—
—
0
1
—
—
Louisiana
—
0
0
—
—
—
0
1
—
1
—
0
1
1
—
Oklahoma
—
0
1
—
—
—
0
3
—
—
—
0
2
2
—
Texas
—
1
7
—
—
—
1
7
—
2
—
0
3
1
2
Mountain
—
2
9
1
5
—
1
6
1
5
—
0
4
2
2
Arizona
—
0
3
—
—
—
0
3
1
2
—
0
3
1
—
Colorado
—
0
0
—
—
—
0
2
—
2
—
0
1
1
1
Idaho
—
0
3
1
4
—
0
1
—
—
—
0
1
—
—
Montana
—
0
3
—
1
—
0
0
—
—
—
0
1
—
—
Nevada
—
0
2
—
—
—
0
1
—
1
—
0
1
—
—
New Mexico
—
0
3
—
—
—
0
0
—
—
—
0
1
—
—
Utah
—
0
3
—
—
—
0
2
—
—
—
0
2
—
—
Wyoming
—
0
1
—
—
—
0
0
—
—
—
0
1
—
1
Pacific
1
3
9
1
6
3
3
8
11
7
1
2
8
15
26
Alaska
1
0
4
1
1
—
0
1
—
—
—
0
0
—
—
California
—
1
6
—
4
3
2
7
11
7
—
2
6
4
23
Hawaii
N
0
0
N
N
—
0
1
—
—
—
0
1
1
—
Oregon
—
1
3
—
1
—
0
1
—
—
1
0
3
7
2
Washington
—
0
3
—
—
—
0
3
—
—
—
0
5
3
1
Territories
American Samoa
N
—
—
N
N
—
—
—
—
—
—
—
—
—
—
C.N.M.I.
—
—
—
—
—
—
—
—
—
—
—
—
—
—
—
Guam
—
0
0
—
—
—
0
0
—
—
—
0
0
—
—
Puerto Rico
N
0
0
N
N
—
0
0
—
—
—
0
0
—
—
U.S. Virgin Islands
N
0
0
N
N
—
0
0
—
—
—
0
0
—
—
C.N.M.I.: Commonwealth of Northern Mariana Islands.
U: Unavailable. —: No reported cases. N: Not reportable. NN: Not Nationally Notifiable. Cum: Cumulative year-to-date counts. Med: Median. Max: Maximum.
† Data for meningococcal disease, invasive caused by serogroups A, C, Y, and W-135; serogroup B; other serogroup; and unknown serogroup are available in Table I.
TABLE II. (Continued) Provisional cases of selected notifiable diseases, United States, weeks ending February 1, 2014, and February 2, 2013 (5th week)* (Export data)
Reporting area
Mumps
Pertussis
Rabies, animal
Current week
Previous 52 weeks
Cum 2014
Cum 2013
Current week
Previous 52 weeks
Cum 2014
Cum 2013
Current week
Previous 52 weeks
Cum 2014
Cum 2013
Med
Max
Med
Max
Med
Max
United States
4
6
45
22
23
174
499
639
1,242
2,025
11
62
132
88
240
New England
—
0
24
—
1
—
18
40
21
147
1
5
12
11
21
Connecticut
—
0
2
—
1
—
1
6
—
4
—
3
12
4
9
Maine
—
0
1
—
—
—
5
12
19
46
—
1
4
2
3
Massachusetts
—
0
24
—
—
—
6
24
—
21
—
0
0
—
—
New Hampshire
—
0
0
—
—
—
1
9
1
17
1
0
3
1
2
Rhode Island
—
0
1
—
—
—
1
16
—
17
—
0
4
1
2
Vermont
—
0
1
—
—
—
1
8
1
42
—
1
4
3
5
Mid. Atlantic
1
1
20
3
5
23
31
46
104
243
2
6
19
21
23
New Jersey
—
0
19
—
—
—
5
13
—
72
—
0
0
—
—
New York (Upstate)
1
0
2
1
—
16
12
35
49
79
2
6
19
21
23
New York City
—
0
4
2
2
—
2
10
1
16
—
0
0
—
—
Pennsylvania
—
0
5
—
3
7
12
19
54
76
—
0
0
—
—
E.N. Central
2
1
6
11
5
64
89
179
431
418
—
2
24
—
3
Illinois
—
0
4
3
3
—
13
33
23
76
—
1
6
—
2
Indiana
—
0
1
1
—
—
10
29
2
37
—
0
1
—
—
Michigan
—
0
1
1
1
3
18
33
59
45
—
0
5
—
1
Ohio
2
0
2
6
1
61
24
104
308
85
—
0
19
—
—
Wisconsin
—
0
1
—
—
—
21
53
39
175
N
0
0
N
N
W.N. Central
—
0
2
1
—
7
41
87
87
223
1
2
9
4
7
Iowa
—
0
1
—
—
—
4
12
5
47
—
0
0
—
—
Kansas
—
0
1
1
—
—
6
20
11
24
—
1
5
2
4
Minnesota
—
0
1
—
—
—
12
37
—
86
—
0
0
—
—
Missouri
—
0
2
—
—
3
10
33
37
45
—
0
3
1
3
Nebraska
—
0
0
—
—
4
5
13
28
15
—
0
0
—
—
North Dakota
—
0
1
—
—
—
1
7
1
2
—
0
0
—
—
South Dakota
—
0
0
—
—
—
1
8
5
4
1
0
4
1
—
S. Atlantic
1
0
26
5
—
36
43
92
198
129
4
17
31
28
153
Delaware
—
0
0
—
—
7
0
3
8
7
—
0
0
—
—
District of Columbia
—
0
1
—
—
—
0
4
1
4
—
0
0
—
—
Florida
1
0
1
1
—
19
14
63
85
26
—
0
9
8
94
Georgia
—
0
4
4
—
—
5
11
22
32
—
0
0
—
—
Maryland
—
0
26
—
—
2
3
10
11
25
4
7
17
19
18
North Carolina
—
0
1
—
—
8
11
29
56
13
—
0
0
—
—
South Carolina
—
0
1
—
—
—
4
8
3
20
—
0
0
—
—
Virginia
—
0
2
—
—
—
1
20
8
—
—
8
15
—
37
West Virginia
—
0
0
—
—
—
0
3
4
2
—
1
6
1
4
E.S. Central
—
0
3
1
3
1
15
35
66
86
—
1
7
4
2
Alabama
—
0
1
—
1
1
3
8
16
19
—
0
6
3
2
Kentucky
—
0
0
—
1
—
6
27
26
37
—
0
3
1
—
Mississippi
—
0
0
—
—
—
1
4
1
6
—
0
2
—
—
Tennessee
—
0
3
1
1
—
5
10
23
24
—
0
0
—
—
W.S. Central
—
0
3
1
2
29
83
298
69
56
3
17
77
20
27
Arkansas
—
0
1
—
—
2
8
22
10
15
—
1
34
5
10
Louisiana
—
0
1
—
1
—
3
11
4
4
—
0
0
—
—
Oklahoma
—
0
1
—
—
—
0
36
1
1
1
0
31
3
—
Texas
—
0
3
1
1
27
68
276
54
36
2
16
40
12
17
Mountain
—
0
2
—
2
5
91
175
204
501
—
0
9
—
—
Arizona
—
0
1
—
—
1
21
70
18
127
N
0
0
N
N
Colorado
—
0
1
—
1
—
20
46
130
123
—
0
0
—
—
Idaho
—
0
0
—
—
1
4
10
17
14
—
0
4
—
—
Montana
—
0
0
—
—
3
12
29
21
66
N
0
0
N
N
Nevada
—
0
2
—
—
—
2
12
3
7
—
0
3
—
—
New Mexico
—
0
1
—
—
—
9
22
—
80
—
0
1
—
—
Utah
—
0
1
—
1
—
22
41
15
84
—
0
4
—
—
Wyoming
—
0
0
—
—
—
1
12
—
—
—
0
0
—
—
Pacific
—
0
4
—
5
9
59
110
62
222
—
3
12
—
4
Alaska
—
0
1
—
—
—
5
18
3
71
—
0
2
—
1
California
—
0
4
—
5
5
30
53
44
99
—
3
11
—
3
Hawaii
—
0
1
—
—
—
1
4
—
1
—
0
0
—
—
Oregon
—
0
1
—
—
3
8
26
14
42
—
0
2
—
—
Washington
—
0
1
—
—
1
12
52
1
9
—
0
0
—
—
Territories
American Samoa
—
—
—
—
—
—
—
—
—
—
N
—
—
N
N
C.N.M.I.
—
—
—
—
—
—
—
—
—
—
—
—
—
—
—
Guam
—
0
0
—
—
—
0
0
—
—
—
0
0
—
—
Puerto Rico
—
0
1
—
1
—
0
6
—
—
—
0
0
—
—
U.S. Virgin Islands
—
0
0
—
—
—
0
0
—
—
—
0
0
—
—
C.N.M.I.: Commonwealth of Northern Mariana Islands.
U: Unavailable. —: No reported cases. N: Not reportable. NN: Not Nationally Notifiable. Cum: Cumulative year-to-date counts. Med: Median. Max: Maximum.
TABLE II. (Continued) Provisional cases of selected notifiable diseases, United States, weeks ending February 1, 2014, and February 2, 2013 (5th week)* (Export data)
Reporting area
Salmonellosis
Shiga toxin-producing E. coli (STEC)†
Shigellosis
Current week
Previous 52 weeks
Cum 2014
Cum 2013
Current week
Previous 52 weeks
Cum 2014
Cum 2013
Current week
Previous 52 weeks
Cum 2014
Cum 2013
Med
Max
Med
Max
Med
Max
United States
305
888
1,520
1,804
2,412
32
113
264
162
287
118
218
371
934
685
New England
7
39
81
83
92
—
4
12
8
12
1
3
94
20
20
Connecticut
1
7
21
19
24
—
1
7
2
3
—
1
5
4
3
Maine
2
2
11
4
4
—
0
4
—
—
—
0
1
1
—
Massachusetts
2
21
54
44
47
—
2
8
4
7
1
2
11
14
14
New Hampshire
—
3
11
3
10
—
0
2
1
2
—
0
1
1
1
Rhode Island
—
2
13
—
1
—
0
2
—
—
—
0
86
—
—
Vermont
2
1
5
13
6
—
0
3
1
—
—
0
1
—
2
Mid. Atlantic
39
96
196
176
247
4
13
38
19
27
2
15
28
46
85
New Jersey
—
18
46
7
51
—
2
8
—
8
—
2
7
2
9
New York (Upstate)
27
24
50
60
48
4
4
10
8
5
2
4
14
18
31
New York City
5
20
52
62
68
—
2
8
3
6
—
6
14
19
31
Pennsylvania
7
29
65
47
80
—
5
19
8
8
—
2
9
7
14
E.N. Central
18
98
171
134
339
2
15
47
12
74
7
23
74
67
211
Illinois
—
31
62
28
130
—
4
32
6
17
—
5
16
—
9
Indiana
—
13
27
2
38
—
2
7
—
13
—
2
7
—
9
Michigan
3
17
42
25
57
—
2
14
1
15
—
3
8
6
23
Ohio
15
22
42
74
57
2
3
15
5
9
7
10
67
58
163
Wisconsin
—
13
29
5
57
—
2
12
—
20
—
0
3
3
7
W.N. Central
3
46
93
77
138
—
10
38
10
39
5
7
74
112
25
Iowa
—
10
36
18
37
—
2
14
2
5
—
3
43
27
6
Kansas
—
7
18
10
18
—
1
6
—
6
—
0
4
2
3
Minnesota
—
0
0
—
—
—
0
0
—
—
—
0
0
—
—
Missouri
3
18
38
33
59
—
4
18
4
23
2
2
9
18
4
Nebraska
—
5
20
10
10
—
1
7
3
3
—
1
4
1
9
North Dakota
—
2
7
2
5
—
0
3
1
—
—
0
2
2
3
South Dakota
—
3
10
4
9
—
0
5
—
2
3
0
29
62
—
S. Atlantic
130
232
436
793
679
4
10
18
36
33
43
49
159
353
95
Delaware
—
1
7
4
8
—
0
2
—
—
—
0
2
3
1
District of Columbia
—
0
3
—
5
—
0
1
—
1
—
0
2
—
1
Florida
74
105
226
384
318
3
3
7
16
7
20
18
46
101
31
Georgia
2
34
101
77
107
—
2
10
4
9
1
16
36
68
39
Maryland
8
16
37
54
67
1
1
8
8
9
5
2
6
14
7
North Carolina
36
32
136
170
97
—
1
8
5
5
14
2
119
150
11
South Carolina
5
20
52
51
60
—
0
2
1
—
2
3
6
8
4
Virginia
5
6
32
45
4
—
0
4
2
—
1
1
7
9
—
West Virginia
—
3
9
8
13
—
0
3
—
2
—
0
2
—
1
E.S. Central
13
57
138
109
171
5
5
18
15
19
14
20
66
135
46
Alabama
1
17
69
23
53
—
1
3
1
4
1
5
14
24
14
Kentucky
5
9
21
26
33
3
2
9
7
4
—
1
6
3
12
Mississippi
—
13
41
25
38
—
0
4
—
1
—
4
13
15
15
Tennessee
7
16
36
35
47
2
2
6
7
10
13
9
50
93
5
W.S. Central
38
118
248
128
190
9
13
34
34
18
20
48
201
90
75
Arkansas
4
13
35
15
18
1
1
6
4
1
7
5
22
18
4
Louisiana
1
19
43
27
47
—
0
2
—
2
—
5
21
7
11
Oklahoma
11
12
49
32
23
—
1
10
1
—
—
3
13
4
18
Texas
22
72
210
54
102
8
9
29
29
15
13
28
174
61
42
Mountain
5
51
248
86
151
3
10
59
10
30
2
10
38
44
37
Arizona
2
18
32
23
54
—
2
45
—
12
2
6
27
24
20
Colorado
—
6
27
31
29
—
0
11
—
7
—
1
5
6
4
Idaho
2
2
9
9
7
3
2
6
5
5
—
0
3
3
—
Montana
1
2
9
6
4
—
1
5
—
—
—
0
10
1
—
Nevada
—
4
205
3
20
—
1
3
1
3
—
0
7
5
6
New Mexico
—
6
14
—
22
—
0
3
2
—
—
1
5
—
5
Utah
—
6
14
14
13
—
1
9
2
3
—
0
2
5
2
Wyoming
—
1
4
—
2
—
0
7
—
—
—
0
2
—
—
Pacific
52
111
217
218
405
5
18
51
18
35
24
20
47
67
91
Alaska
4
1
5
6
—
—
0
0
—
—
—
0
1
1
—
California
39
87
171
158
363
3
10
26
10
26
24
16
47
60
78
Hawaii
5
7
13
29
15
—
0
5
2
1
—
0
6
1
4
Oregon
2
6
25
19
14
—
3
14
4
4
—
1
4
5
4
Washington
2
10
48
6
13
2
3
32
2
4
—
1
10
—
5
Territories
American Samoa
—
—
—
—
—
—
—
—
—
—
—
—
—
—
—
C.N.M.I.
—
—
—
—
—
—
—
—
—
—
—
—
—
—
—
Guam
—
0
0
—
—
—
0
0
—
—
—
0
0
—
—
Puerto Rico
—
7
43
—
37
—
0
6
—
—
—
0
1
—
—
U.S. Virgin Islands
—
0
0
—
—
—
0
0
—
—
—
0
0
—
—
C.N.M.I.: Commonwealth of Northern Mariana Islands.
U: Unavailable. —: No reported cases. N: Not reportable. NN: Not Nationally Notifiable. Cum: Cumulative year-to-date counts. Med: Median. Max: Maximum.
† Includes E. coli O157:H7; Shiga toxin-positive, serogroup non-O157; and Shiga toxin-positive, not serogrouped.
TABLE II. (Continued) Provisional cases of selected notifiable diseases, United States, weeks ending February 1, 2014, and February 2, 2013 (5th week)* (Export data)
Reporting area
Spotted Fever Rickettsiosis (including RMSF)†
Syphilis, primary and secondary
Confirmed
Probable
Current week
Previous 52 weeks
Cum 2014
Cum 2013
Current week
Previous 52 weeks
Cum 2014
Cum 2013
Current week
Previous 52 weeks
Cum 2014
Cum 2013
Med
Max
Med
Max
Med
Max
United States
—
3
10
5
10
2
38
172
23
38
84
322
464
829
1,416
New England
—
0
1
—
—
—
0
2
—
1
2
8
19
17
47
Connecticut
—
0
0
—
—
—
0
0
—
—
—
1
6
4
8
Maine
—
0
0
—
—
—
0
1
—
—
—
0
1
—
—
Massachusetts
—
0
0
—
—
—
0
1
—
—
2
7
18
13
36
New Hampshire
—
0
1
—
—
—
0
1
—
1
—
0
3
—
3
Rhode Island
—
0
0
—
—
—
0
2
—
—
—
0
4
—
—
Vermont
—
0
0
—
—
—
0
0
—
—
—
0
2
—
—
Mid. Atlantic
—
0
1
1
1
—
1
6
—
7
8
40
58
116
184
New Jersey
—
0
1
—
—
—
0
4
—
5
—
3
9
2
27
New York (Upstate)
—
0
1
1
—
—
0
3
—
—
5
5
34
18
15
New York City
—
0
1
—
—
—
0
1
—
—
2
21
35
67
103
Pennsylvania
—
0
1
—
1
—
0
3
—
2
1
9
16
29
39
E.N. Central
—
0
2
—
—
—
2
14
2
5
2
34
57
47
178
Illinois
—
0
1
—
—
—
1
8
—
1
2
11
29
9
86
Indiana
—
0
1
—
—
—
0
4
—
3
—
4
10
8
13
Michigan
—
0
1
—
—
—
0
1
—
—
—
8
17
8
35
Ohio
—
0
1
—
—
—
0
2
2
1
—
8
14
18
35
Wisconsin
—
0
1
—
—
—
0
2
—
—
—
1
5
4
9
W.N. Central
—
0
1
1
—
—
3
26
2
—
—
12
25
20
52
Iowa
—
0
0
—
—
—
0
2
—
—
—
1
6
1
7
Kansas
—
0
0
—
—
—
0
0
—
—
—
1
4
2
2
Minnesota
—
0
0
—
—
—
0
0
—
—
—
3
8
—
15
Missouri
—
0
1
1
—
—
3
25
2
—
—
4
10
11
19
Nebraska
—
0
1
—
—
—
0
2
—
—
—
1
3
3
7
North Dakota
—
0
0
—
—
—
0
1
—
—
—
0
2
—
—
South Dakota
—
0
1
—
—
—
0
1
—
—
—
0
3
3
2
S. Atlantic
—
2
7
3
9
1
7
55
9
10
43
77
151
281
255
Delaware
—
0
0
—
—
—
0
2
2
1
2
0
9
5
2
District of Columbia
—
0
1
—
—
—
0
0
—
—
—
3
8
—
21
Florida
—
0
2
—
—
—
0
4
2
1
2
27
43
99
129
Georgia
—
1
7
3
8
—
0
0
—
—
5
15
49
64
39
Maryland
—
0
1
—
—
—
0
4
—
2
6
9
16
34
30
North Carolina
—
0
2
—
—
—
1
47
—
—
5
7
31
32
4
South Carolina
—
0
1
—
1
—
1
2
1
6
5
5
13
22
19
Virginia
—
0
1
—
—
1
1
12
3
—
18
5
17
25
10
West Virginia
—
0
1
—
—
—
0
2
1
—
—
0
2
—
1
E.S. Central
—
0
3
—
—
1
11
49
9
9
8
11
22
46
46
Alabama
—
0
1
—
—
—
3
17
3
1
—
4
8
4
12
Kentucky
—
0
1
—
—
—
1
6
3
2
6
2
8
14
5
Mississippi
—
0
1
—
—
—
0
4
—
—
1
1
19
24
8
Tennessee
—
0
2
—
—
1
7
30
3
6
1
3
8
4
21
W.S. Central
—
0
4
—
—
—
7
104
1
2
—
40
65
73
216
Arkansas
—
0
2
—
—
—
4
28
1
1
—
3
10
5
11
Louisiana
—
0
0
—
—
—
0
1
—
—
—
6
18
7
32
Oklahoma
—
0
4
—
—
—
0
88
—
—
—
2
8
6
11
Texas
—
0
1
—
—
—
1
4
—
1
—
29
41
55
162
Mountain
—
0
3
—
—
—
1
4
—
4
1
15
26
41
59
Arizona
—
0
3
—
—
—
0
4
—
4
—
5
12
5
17
Colorado
—
0
0
—
—
—
0
0
—
—
1
3
9
6
18
Idaho
—
0
1
—
—
—
0
0
—
—
—
0
2
—
—
Montana
—
0
0
—
—
—
0
1
—
—
—
0
1
—
1
Nevada
—
0
0
—
—
—
0
1
—
—
—
4
14
26
10
New Mexico
—
0
0
—
—
—
0
1
—
—
—
1
5
2
7
Utah
—
0
0
—
—
—
0
1
—
—
—
1
5
2
6
Wyoming
—
0
0
—
—
—
0
1
—
—
—
0
1
—
—
Pacific
—
0
1
—
—
—
0
1
—
—
20
77
110
188
379
Alaska
N
0
0
N
N
N
0
0
N
N
—
0
3
2
4
California
—
0
1
—
—
—
0
1
—
—
16
65
94
164
314
Hawaii
N
0
0
N
N
N
0
0
N
N
—
0
3
1
3
Oregon
—
0
1
—
—
—
0
1
—
—
—
5
11
5
36
Washington
—
0
0
—
—
—
0
0
—
—
4
5
14
16
22
Territories
American Samoa
N
—
—
N
N
N
—
—
N
N
—
—
—
—
—
C.N.M.I.
—
—
—
—
—
—
—
—
—
—
—
—
—
—
—
Guam
N
0
0
N
N
N
0
0
N
N
—
0
0
—
—
Puerto Rico
N
0
0
N
N
N
0
0
N
N
—
7
30
24
29
U.S. Virgin Islands
N
0
0
N
N
N
0
0
N
N
—
0
1
—
—
C.N.M.I.: Commonwealth of Northern Mariana Islands.
U: Unavailable. —: No reported cases. N: Not reportable. NN: Not Nationally Notifiable. Cum: Cumulative year-to-date counts. Med: Median. Max: Maximum.
† Illnesses with similar clinical presentation that result from Spotted fever group rickettsia infections are reported as Spotted fever rickettsioses. Rocky Mountain spotted fever (RMSF) caused by Rickettsia rickettsii, is the most common and well-known spotted fever.
TABLE II. (Continued) Provisional cases of selected notifiable diseases, United States, weeks ending February 1, 2014, and February 2, 2013 (5th week)* (Export data)
Reporting area
Varicella (chickenpox)
West Nile virus disease†
Neuroinvasive
Nonneuroinvasive§
Current week
Previous 52 weeks
Cum 2014
Cum 2013
Current week
Previous 52 weeks
Cum 2014
Cum 2013
Current week
Previous 52 weeks
Cum 2014
Cum 2013
Med
Max
Med
Max
Med
Max
United States
67
210
287
498
885
—
1
158
—
—
—
1
162
—
1
New England
10
17
42
63
95
—
0
3
—
—
—
0
2
—
—
Connecticut
1
4
9
16
36
—
0
1
—
—
—
0
1
—
—
Maine
5
3
7
19
16
—
0
0
—
—
—
0
0
—
—
Massachusetts
3
7
15
21
32
—
0
2
—
—
—
0
1
—
—
New Hampshire
—
1
4
—
7
—
0
1
—
—
—
0
0
—
—
Rhode Island
—
0
4
2
1
—
0
1
—
—
—
0
0
—
—
Vermont
1
1
27
5
3
—
0
1
—
—
—
0
1
—
—
Mid. Atlantic
10
19
39
59
121
—
0
7
—
—
—
0
6
—
—
New Jersey
—
4
21
—
46
—
0
4
—
—
—
0
2
—
—
New York (Upstate)
N
0
0
N
N
—
0
2
—
—
—
0
4
—
—
New York City
—
0
0
—
—
—
0
2
—
—
—
0
1
—
—
Pennsylvania
10
15
27
59
75
—
0
1
—
—
—
0
1
—
—
E.N. Central
20
63
104
155
281
—
0
26
—
—
—
0
14
—
—
Illinois
1
13
32
23
69
—
0
21
—
—
—
0
8
—
—
Indiana
1
5
14
22
30
—
0
6
—
—
—
0
1
—
—
Michigan
—
20
44
32
60
—
0
5
—
—
—
0
4
—
—
Ohio
16
13
33
54
84
—
0
3
—
—
—
0
2
—
—
Wisconsin
2
6
23
24
38
—
0
3
—
—
—
0
1
—
—
W.N. Central
1
5
15
11
35
—
0
51
—
—
—
0
69
—
—
Iowa
N
0
0
N
N
—
0
10
—
—
—
0
5
—
—
Kansas
—
0
0
—
—
—
0
8
—
—
—
0
17
—
—
Minnesota
—
0
0
—
—
—
0
7
—
—
—
0
8
—
—
Missouri
—
4
13
4
28
—
0
6
—
—
—
0
1
—
—
Nebraska
—
0
2
1
—
—
0
14
—
—
—
0
29
—
—
North Dakota
—
0
4
1
7
—
0
11
—
—
—
0
9
—
—
South Dakota
1
1
4
5
—
—
0
10
—
—
—
0
12
—
—
S. Atlantic
1
26
49
68
105
—
0
8
—
—
—
0
3
—
1
Delaware
—
0
2
—
—
—
0
1
—
—
—
0
0
—
—
District of Columbia
—
0
2
—
3
—
0
0
—
—
—
0
1
—
—
Florida
—
13
25
35
66
—
0
1
—
—
—
0
1
—
—
Georgia
—
0
5
1
9
—
0
1
—
—
—
0
1
—
—
Maryland
N
0
0
N
N
—
0
4
—
—
—
0
3
—
—
North Carolina
—
0
0
—
—
—
0
2
—
—
—
0
0
—
—
South Carolina
1
2
13
4
4
—
0
1
—
—
—
0
1
—
1
Virginia
—
6
19
16
20
—
0
2
—
—
—
0
0
—
—
West Virginia
—
2
8
12
3
—
0
0
—
—
—
0
0
—
—
E.S. Central
—
3
9
6
9
—
0
6
—
—
—
0
7
—
—
Alabama
—
3
8
6
9
—
0
0
—
—
—
0
3
—
—
Kentucky
N
0
0
N
N
—
0
1
—
—
—
0
1
—
—
Mississippi
—
0
1
—
—
—
0
5
—
—
—
0
3
—
—
Tennessee
N
0
0
N
N
—
0
3
—
—
—
0
2
—
—
W.S. Central
22
39
104
52
114
—
0
29
—
—
—
0
17
—
—
Arkansas
—
3
17
3
13
—
0
3
—
—
—
0
1
—
—
Louisiana
—
1
7
2
6
—
0
7
—
—
—
0
3
—
—
Oklahoma
N
0
0
N
N
—
0
9
—
—
—
0
5
—
—
Texas
22
33
103
47
95
—
0
16
—
—
—
0
12
—
—
Mountain
2
18
39
81
118
—
0
29
—
—
—
0
53
—
—
Arizona
—
6
23
17
39
—
0
4
—
—
—
0
2
—
—
Colorado
—
3
20
32
35
—
0
17
—
—
—
0
34
—
—
Idaho
N
0
0
N
N
—
0
5
—
—
—
0
7
—
—
Montana
1
1
6
7
11
—
0
5
—
—
—
0
7
—
—
Nevada
N
0
0
N
N
—
0
4
—
—
—
0
1
—
—
New Mexico
—
1
5
8
6
—
0
4
—
—
—
0
3
—
—
Utah
1
4
13
17
26
—
0
1
—
—
—
0
1
—
—
Wyoming
—
0
2
—
1
—
0
4
—
—
—
0
6
—
—
Pacific
1
2
6
3
7
—
0
27
—
—
—
0
18
—
—
Alaska
1
1
6
1
5
—
0
0
—
—
—
0
0
—
—
California
—
0
2
1
1
—
0
27
—
—
—
0
18
—
—
Hawaii
—
0
4
1
1
—
0
0
—
—
—
0
0
—
—
Oregon
N
0
0
N
N
—
0
2
—
—
—
0
3
—
—
Washington
N
0
0
N
N
—
0
0
—
—
—
0
1
—
—
Territories
American Samoa
N
—
—
N
N
—
—
—
—
—
—
—
—
—
—
C.N.M.I.
—
—
—
—
—
—
—
—
—
—
—
—
—
—
—
Guam
—
0
0
—
—
—
0
0
—
—
—
0
0
—
—
Puerto Rico
—
4
14
—
20
—
0
0
—
—
—
0
0
—
—
U.S. Virgin Islands
—
0
0
—
—
—
0
0
—
—
—
0
0
—
—
C.N.M.I.: Commonwealth of Northern Mariana Islands.
U: Unavailable. —: No reported cases. N: Not reportable. NN: Not Nationally Notifiable. Cum: Cumulative year-to-date counts. Med: Median. Max: Maximum.
† Updated weekly from reports to the Division of Vector-Borne Infectious Diseases, National Center for Zoonotic, Vector-Borne, and Enteric Diseases (ArboNET Surveillance). Data for California serogroup, eastern equine, Powassan, St. Louis, and western equine diseases are available in Table I.
§ Not reportable in all states. Data from states where the condition is not reportable are excluded from this table, except starting in 2007 for the domestic arboviral diseases and influenza-associated pediatric mortality, and in 2003 for SARS-CoV. Reporting exceptions are available at http://wwwn.cdc.gov/nndss/document/SRCA_FINAL_REPORT_2006-2012_final.xlsx.
TABLE III. Deaths in 122 U.S. cities,* week ending February 1, 2014 (5th week)
Reporting area
All causes, by age (years)
P&I† Total
Reporting area (Continued)
All causes, by age (years)
P&I† Total
All Ages
=65
45–64
25–44
1–24
<1
All Ages
=65
45–64
25–44
1–24
<1
New England
628
436
149
23
10
10
53
S. Atlantic
983
648
235
59
24
17
62
Boston, MA
165
103
43
9
6
4
10
Atlanta, GA
74
48
15
7
4
—
6
Bridgeport, CT
43
33
9
1
—
—
1
Baltimore, MD
—
—
—
—
—
—
—
Cambridge, MA
16
14
2
—
—
—
2
Charlotte, NC
143
93
33
11
2
4
9
Fall River, MA
28
21
4
3
—
—
6
Jacksonville, FL
174
114
41
10
6
3
13
Hartford, CT
62
41
12
6
3
—
5
Miami, FL
80
60
17
3
—
—
1
Lowell, MA
24
24
—
—
—
—
5
Norfolk, VA
50
28
15
3
1
3
1
Lynn, MA
9
8
1
—
—
—
1
Richmond, VA
56
39
14
2
1
—
1
New Bedford, MA
21
16
5
—
—
—
—
Savannah, GA
44
25
13
4
1
1
5
New Haven, CT
39
22
15
—
—
2
4
St. Petersburg, FL
71
46
19
5
—
1
4
Providence, RI
72
52
17
2
1
—
2
Tampa, FL
125
89
22
9
3
2
14
Somerville, MA
5
5
—
—
—
—
—
Washington, D.C.
151
92
45
5
6
3
8
Springfield, MA
53
37
16
—
—
—
4
Wilmington, DE
15
14
1
—
—
—
—
Waterbury, CT
31
20
11
—
—
—
2
E.S. Central
1,049
681
255
82
17
14
118
Worcester, MA
60
40
14
2
—
4
11
Birmingham, AL
146
91
37
14
2
2
17
Mid. Atlantic
1,923
1,369
424
87
27
16
121
Chattanooga, TN
98
62
22
8
4
2
6
Albany, NY
58
33
20
2
—
3
3
Knoxville, TN
148
99
36
10
3
—
31
Allentown, PA
25
19
5
1
—
—
2
Lexington, KY
93
58
23
10
—
2
3
Buffalo, NY
107
68
29
1
3
6
7
Memphis, TN
252
166
60
16
6
4
29
Camden, NJ
16
11
5
—
—
—
2
Mobile, AL
75
55
19
1
—
—
8
Elizabeth, NJ
14
11
3
—
—
—
2
Montgomery, AL
54
37
8
7
2
—
2
Erie, PA
74
50
19
4
1
—
5
Nashville, TN
183
113
50
16
—
4
22
Jersey City, NJ
29
12
15
2
—
—
2
W.S. Central
1,756
1,122
464
102
48
20
122
New York City, NY
1,171
835
251
60
20
5
67
Austin, TX
133
96
24
6
5
2
11
Newark, NJ
30
18
10
1
1
—
—
Baton Rouge, LA
67
43
17
4
2
1
9
Paterson, NJ
U
U
U
U
U
U
U
Corpus Christi, TX
75
42
26
4
2
1
11
Philadelphia, PA
U
U
U
U
U
U
U
Dallas, TX
264
157
74
17
8
8
30
Pittsburgh, PA§
49
41
8
—
—
—
6
El Paso, TX
141
92
38
6
3
2
2
Reading, PA
33
28
5
—
—
—
2
Fort Worth, TX
U
U
U
U
U
U
U
Rochester, NY
143
104
26
9
2
2
13
Houston, TX
523
309
161
32
19
2
11
Schenectady, NY
25
22
2
1
—
—
1
Little Rock, AR
15
8
3
2
2
—
—
Scranton, PA
33
27
4
2
—
—
2
New Orleans, LA
45
24
13
4
3
1
4
Syracuse, NY
90
71
16
3
—
—
6
San Antonio, TX
324
230
72
17
3
2
31
Trenton, NJ
U
U
U
U
U
U
U
Shreveport, LA
92
54
28
8
1
1
4
Utica, NY
9
8
1
—
—
—
—
Tulsa, OK
77
67
8
2
—
—
9
Yonkers, NY
17
11
5
1
—
—
1
Mountain
1,150
802
243
72
26
7
96
E.N. Central
2,125
1,453
513
99
35
25
174
Albuquerque, NM
160
105
42
10
3
—
22
Akron, OH
51
36
11
1
1
2
6
Boise, ID
63
52
8
2
—
1
5
Canton, OH
37
24
12
1
—
—
4
Colorado Springs, CO
76
48
16
9
1
2
3
Chicago, IL
270
177
74
11
7
1
13
Denver, CO
99
65
18
10
4
2
5
Cincinnati, OH
79
47
28
3
1
—
7
Las Vegas, NV
353
233
91
21
6
2
29
Cleveland, OH
317
229
78
5
3
2
18
Ogden, UT
38
31
6
1
—
—
1
Columbus, OH
286
189
66
12
10
9
21
Phoenix, AZ
U
U
U
U
U
U
U
Dayton, OH
135
88
34
8
4
1
13
Pueblo, CO
37
29
7
—
1
—
3
Detroit, MI
U
U
U
U
U
U
U
Salt Lake City, UT
147
102
25
13
7
—
15
Evansville, IN
51
41
8
2
—
—
9
Tucson, AZ
177
137
30
6
4
—
13
Fort Wayne, IN
103
73
21
7
—
2
3
Pacific
2,045
1,440
449
90
42
24
234
Gary, IN
13
10
3
—
—
—
3
Berkeley, CA
13
6
4
—
—
3
2
Grand Rapids, MI
51
36
11
2
—
2
8
Fresno, CA
152
112
30
8
1
1
22
Indianapolis, IN
228
137
62
20
6
3
30
Glendale, CA
34
28
5
1
—
—
8
Lansing, MI
74
52
15
6
1
—
9
Honolulu, HI
76
55
13
5
3
—
15
Milwaukee, WI
73
56
12
4
—
1
11
Long Beach, CA
68
43
20
3
2
—
11
Peoria, IL
70
54
13
1
1
1
2
Los Angeles, CA
293
190
76
16
9
2
47
Rockford, IL
63
47
12
2
1
1
4
Pasadena, CA
36
29
5
1
1
—
4
South Bend, IN
51
34
15
2
—
—
1
Portland, OR
120
91
24
3
1
1
15
Toledo, OH
109
73
27
9
—
—
10
Sacramento, CA
277
208
50
14
3
2
36
Youngstown, OH
64
50
11
3
—
—
2
San Diego, CA
185
131
39
9
4
2
18
W.N. Central
840
562
199
47
19
11
89
San Francisco, CA
142
99
36
5
2
—
10
Des Moines, IA
119
86
26
7
—
—
17
San Jose, CA
259
201
46
4
5
3
16
Duluth, MN
28
18
9
1
—
—
5
Santa Cruz, CA
38
27
8
1
1
1
3
Kansas City, KS
29
15
6
3
4
1
1
Seattle, WA
140
86
39
9
1
5
4
Kansas City, MO
142
96
33
6
4
1
15
Spokane, WA
73
51
15
2
1
4
6
Lincoln, NE
44
36
7
1
—
—
4
Tacoma, WA
139
83
39
9
8
—
17
Minneapolis, MN
84
53
22
5
2
2
11
Total¶
12,499
8,513
2,931
661
248
144
1,069
Omaha, NE
103
71
20
7
3
2
11
St. Louis, MO
95
53
31
8
1
2
5
St. Paul, MN
65
48
12
2
1
2
7
Wichita, KS
131
86
33
7
4
1
13
U: Unavailable. —: No reported cases.
* Mortality data in this table are voluntarily reported from 122 cities in the United States, most of which have populations of >100,000. A death is reported by the place of its occurrence and by the week that the death certificate was filed. Fetal deaths are not included.
† Pneumonia and influenza.
§ Because of changes in reporting methods in this Pennsylvania city, these numbers are partial counts for the current week. Complete counts will be available in 4 to 6 weeks.