Confirmed and Probable Cases of E. coli O145 Infection, United States, by Date of Illness Onset as of 05/20/10 at 9:00 pm EST (n=33)*
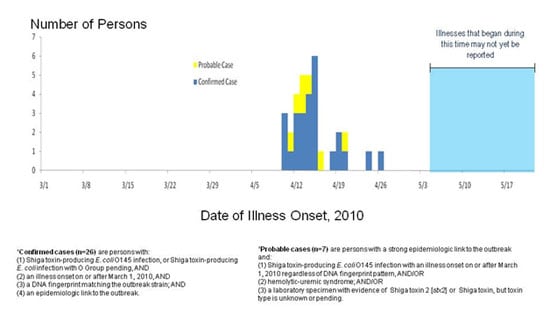
The outbreak can be visually described with a chart showing the number of persons who became ill each day. This chart is called an epidemic curve or epi curve. Of note, it takes an average of 2 to 3 weeks from the time a person becomes ill to the time when the illness is confirmed by laboratory testing and reported. Please see the E. coli Outbreak Investigations: Timeline for Reporting Cases for more details.