
More People Walk to Better Health infographic

The Guide to Community Preventive Services recommends

The Guide to Community Preventive Services recommends:
  • Creating more places for physical activity with information and outreach that
    lets people know where these are.
  • Considering walkability in community design .
  • Using community-wide campaigns to provide health education and social
    support for physical activity. See the full recommendations.

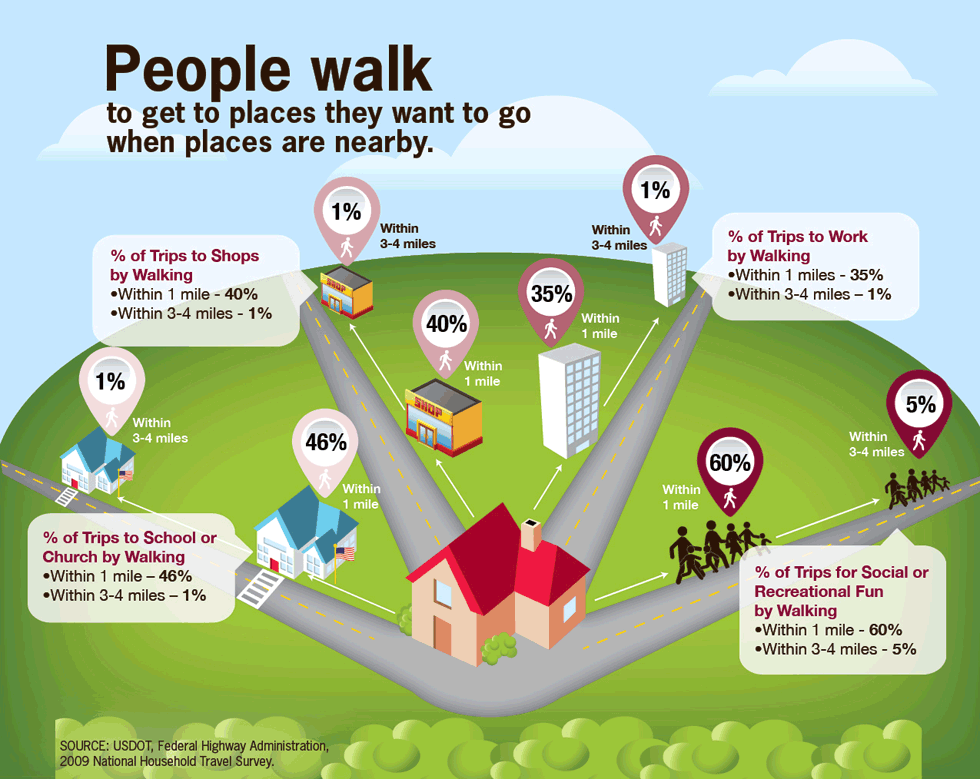
Graphic showing the relationship between the percentages of people who walk to a destination vs. the distance to that destination.Percentage of adults who walk: This chart shows the increase in the percentage of adults who walk by race, age, and whether they need help walking. All groups increased from 2005-2010.

Percentage of adults who walk: This chart shows the increase in the percentage of adults who walk by race, age, and whether they need help walking. All groups increased from 2005-2010.


This diagram shows that when destinations such as work (35%), school or church (46%), shopping (40%), fun (60%) that are within 1 mile, many more people walk than when these destinations are within 3-4 miles. Then the percent walking drops to 1%, unless they are walking for fun (5%).

This diagram shows that when destinations such as work (35%), school or church (46%), shopping (40%), fun (60%) that are within 1 mile, many more people walk than when these destinations are within 3-4 miles. Then the percent walking drops to 1%, unless they are walking for fun (5%).

Syndicated Content Details:
Source URL: http://www.cdc.gov/vitalsigns/Walking/infographic.html
Source Agency: Centers for Disease Control and Prevention (CDC)
Captured Date: 2016-05-23 22:33:40.0


Terms of Use | Privacy Policy
©2017 ARCHES Technology. All Rights Reserved.